Dashboard Overview:
This dashboard provides an in-depth analysis of business performance across various dimensions, including sales, customer transactions, refunds, and product performance. Designed for interactive exploration, it allows users to gain actionable insights with dynamic filtering and time-based analysis.
Key Features:
- Summary Metrics:
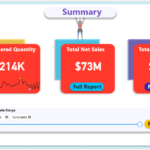
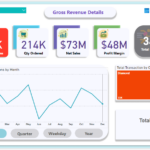
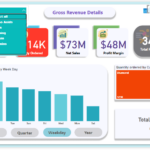
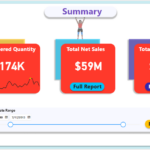
- Ordered Quantity: Displays total units ordered (e.g., 214K units over the selected period).
- Net Sales: Highlights the total revenue generated (e.g., $73M).
- Gross Profit: Represents overall profit (e.g., $48M).
- These metrics offer quick insights into the business’s financial health.
- Dynamic Filtering and Customization:
- Users can filter data by date range, product categories, and customer ratings.
- Filters allow a tailored view, enabling businesses to focus on specific time periods or categories.
- Visual Representations:
- Transactions Over Time: Line charts show monthly transaction trends, providing insights into seasonal patterns.
- Customer Ratings Distribution: Bar and pie charts classify transactions by customer ratings (Diamond, Gold, Silver).
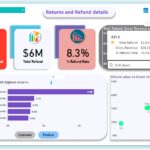
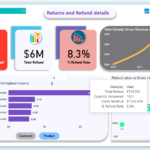
- Product-Specific Returns: Detailed visualizations highlight products with the highest return rates.
- Refund and Returns Analysis:
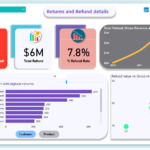
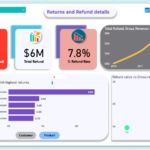
- Metrics such as Total Refund ($6M), Quantity Returned (14K), and Refund Rate (7.8%) help identify loss areas.
- A top 5 products chart shows the items with the most returns, aiding in quality improvements.
- Product Performance Details:
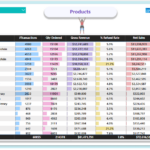
- A tabular view summarizes product-wise metrics such as transactions, ordered quantity, gross revenue, refund rates, and gross profit margins.
- For instance, “Pure Casein Protein” shows a high volume of sales (15,100 units) with a gross profit margin of $7.75M.
- Time-Based Analysis:
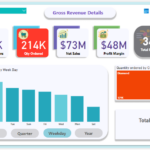
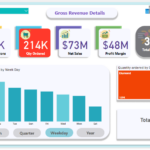
- Allows switching between views by Month, Quarter, Weekday, and Year to identify trends.
- Weekday analysis reveals sales peaks (e.g., highest orders on Thursdays).
- Customer and Product Focus:
- Top customers and products with the highest returns are highlighted, providing actionable insights for improving customer satisfaction and product quality.
Report Insights:
- Business Performance:
- The business has achieved a total gross revenue of $81.47M and a net sales figure of $72.62M for the selected period.
- Gross profit stands strong at $47.91M, reflecting efficient operations.
- Sales Trends:
- Highest sales volume is observed on Thursdays, indicating an opportunity for targeted promotions mid-week.
- A steady decline in transactions during weekends suggests potential to improve weekend engagement strategies.
- Returns and Refunds:
- With a refund rate of 7.8%, it’s crucial to address product quality and customer satisfaction.
- “100% Egg Protein” has the highest return rate, requiring a review of its production or customer targeting strategy.
- Customer Segmentation:
- Diamond customers contribute the most to sales, with 129K units ordered, emphasizing the importance of retaining high-value customers.
- Silver and Gold customers offer growth opportunities with targeted campaigns.
- Product Analysis:
- “Pure Casein Protein” leads in revenue and transactions, while products like “Men’s Jacket” show potential for improvement.
- Products with high refund rates need attention to enhance profitability and reduce losses.
Recommendations:
- Launch mid-week campaigns and promotions to leverage high transaction days.
- Address quality issues for high-return products, focusing on “100% Egg Protein.”
- Develop strategies to boost weekend sales, such as discounts or special offers.
- Implement loyalty programs for high-value Diamond customers to encourage repeat purchases.
- Regularly monitor the refund rate and improve return policies to enhance customer experience.
