Dashboard Overview:
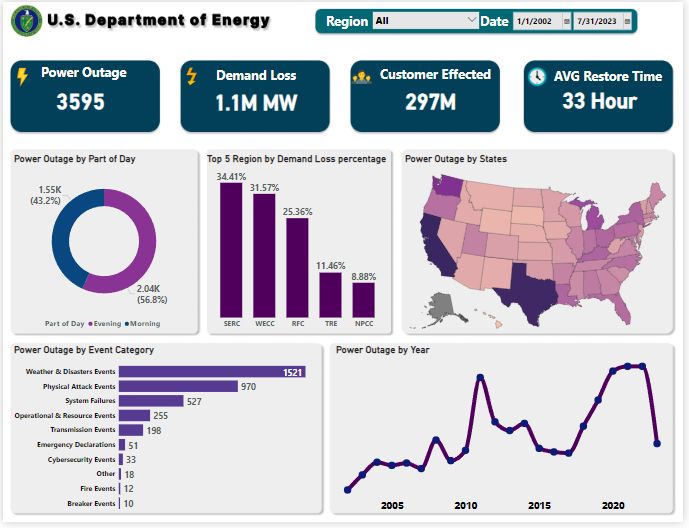
This dashboard provides a comprehensive analysis of power outage incidents across the United States between 2002 and 2023, with a detailed breakdown by region, state, and event categories. It highlights key metrics such as the number of power outages, demand loss, affected customers, and average restoration time.
Key Features:
- Summary Metrics:
- Total Power Outages: 3,595 incidents recorded.
- Demand Loss: 1.1 MW of power.
- Customers Affected: 297 million individuals impacted.
- Average Restoration Time: 33 hours.
- Detailed Insights:
- Power Outages by Part of Day:
- Most outages occur during the evening (56.8%), followed by the day (43.2%).
- Top 5 Regions by Demand Loss Percentage:
- The SERC region accounts for the highest demand loss (34.41%), followed by WECC (31.57%) and RFC (25.36%).
- Power Outage by State:
- A heat map highlights the most affected states, with darker regions indicating higher incidents.
- Event Categories:
- Severe weather is the leading cause of outages, accounting for 1,521 events, followed by physical attacks/vandalism (970) and system failures (527).
- Power Outages by Part of Day:
- Time Trends:
- Power Outages by Year:
- A time series chart shows spikes in outages in years like 2005 and 2020, reflecting trends in weather or system vulnerabilities.
- Power Outages by Year:
- State-Specific Analysis (Texas Example):
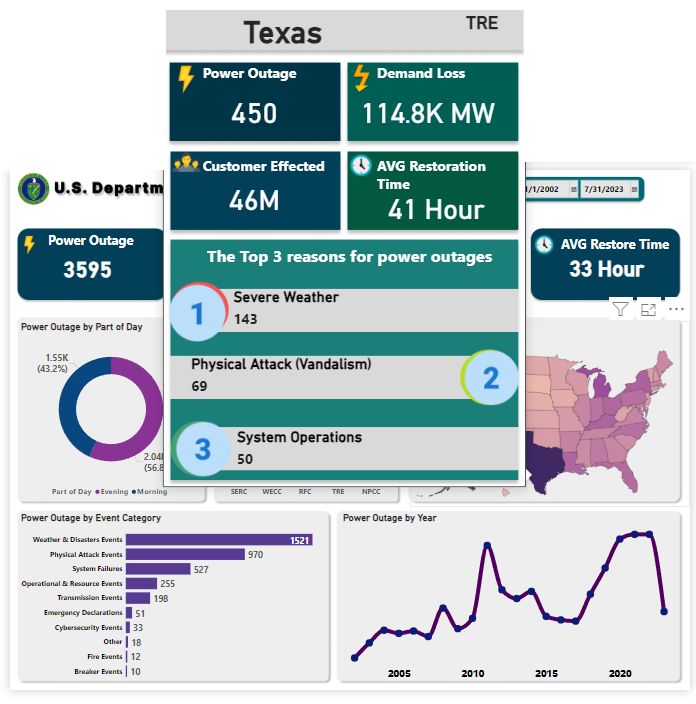
- Total Power Outages: 450 incidents.
- Demand Loss: 114.8 MW.
- Customers Affected: 46 million.
- Average Restoration Time: 41 hours.
- Top 3 Reasons for Outages in Texas:
- Severe weather (143 incidents).
- Physical attacks (69 incidents).
- System operations (50 incidents).
Report Insights:
- National Trends:
- The U.S. experiences significant power outages due to severe weather, highlighting the need for robust infrastructure.
- The average restoration time of 33 hours indicates room for improvement in outage response times.
- Regional and State-Specific Challenges:
- The SERC and WECC regions face the highest demand loss, emphasizing the need for targeted investments in these areas.
- Texas has the highest number of severe weather-related outages, suggesting the necessity of weather-resilient systems.
- Categories of Concern:
- Physical attacks account for 970 incidents, revealing a growing threat to power infrastructure.
- System failures remain a major challenge, pointing to the need for modernization of the grid.
- Yearly Analysis:
- Peaks in outage numbers during certain years coincide with major weather events or grid vulnerabilities.
Recommendations:
- Infrastructure Resilience:
- Invest in weather-resistant technologies and systems to mitigate the impact of severe weather, especially in high-risk states like Texas.
- Security Enhancements:
- Strengthen security measures to reduce physical attacks on the power grid.
- Grid Modernization:
- Address system failures by upgrading aging infrastructure and adopting advanced grid management technologies.
- Regional Strategies:
- Focus on the SERC and WECC regions to reduce demand loss and improve customer reliability.
- Emergency Preparedness:
- Develop rapid response teams to decrease the average restoration time, ensuring quicker recovery from outages.

