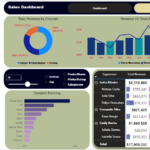
Dashboard Overview:
This sales performance dashboard provides a comprehensive analysis of key business metrics, focusing on revenue, transactions, and product performance. Designed for user interactivity, the dashboard enables detailed exploration of sales data across multiple dimensions, such as revenue channels, salespersons, and products.
Key Features:
- Core Metrics Summary:
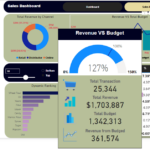
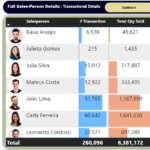
- Total Transactions: 260,096 transactions recorded.
- Total Quantity Sold: 6,381,172 units.
- Total Revenue: $17,909,232.
- Revenue Analysis:
- Revenue by Channel: Sales split across retail (48.56%), distributor (34.05%), and online (17.39%).
- Revenue vs. Budget: Achieved 127% of the budgeted target, exceeding the goal by $361,574.
- Revenue by Manager: Revenue contributions are evenly split between managers Gabriel Azevedo (48.56%) and Victor Castro (51.44%).
- Salesperson Performance:
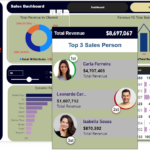
- Top-performing salesperson, Carla Ferreira, generated $4,707,403 in revenue, followed by Leonardo Cardoso ($1,607,712) and Isabella Sousa ($870,302).
- Salespersons’ contributions are ranked dynamically, providing an actionable view of individual performance.
- Product Insights:
- Top-selling products include “Wheat Flour,” “Oil,” and “Yeasts,” highlighting strong performers in the product mix.
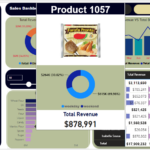
- Product-specific performance, such as “Product 1057,” generated $878,991 in revenue, with the majority (69.98%) occurring during weekends.
- Supervisor Contributions:
- Supervisors like Sofia Ribeiro contributed the most revenue ($3,113,650) and accounted for 22.67% of total quantity sold.
- Time-Based Analysis:
- Monthly trends show peak revenues in October, highlighting seasonal opportunities for promotions or stock adjustments.
- Dynamic Ranking and Filtering:
- Interactive filters by manager, supervisor, product, or channel allow detailed exploration.
- Dynamic ranking visualizes top and bottom performers across dimensions.
Report Insights:
- Sales Achievements:
- The company has surpassed its revenue budget by 127%, demonstrating strong sales performance.
- Retail remains the dominant sales channel, contributing nearly half of the total revenue.
- Team Performance:
- Carla Ferreira leads in revenue generation, indicating a high-performing individual within the team.
- Focused training for low-performing salespersons, such as Julieta Gomes, could help boost overall sales.
- Product Trends:
- Products like “Wheat Flour” and “Oil” are top contributors, suggesting potential for expanding similar product lines.
- Products with significant weekend sales, like “Product 1057,” could benefit from targeted weekend promotions.
- Manager and Supervisor Effectiveness:
- Revenue is equally distributed between managers, reflecting balanced team performance.
- Sofia Ribeiro emerges as the most effective supervisor, accounting for the largest share of sales.
- Seasonality:
- October shows the highest revenue, highlighting the need for peak-season planning to capitalize on demand.
Recommendations:
- Channel Optimization:
- Invest more resources in retail and online channels to capitalize on their high revenue contributions.
- Sales Team Development:
- Offer sales training and incentives for underperforming team members to improve their contributions.
- Product Strategy:
- Expand the portfolio of high-performing products and develop strategies to boost sales during weekends.
- Data-Driven Promotions:
- Utilize insights from monthly trends to plan seasonal campaigns and allocate resources effectively.
- Performance Monitoring:
- Continue leveraging interactive dashboards to monitor performance and make data-driven decisions.
